An Intro to The Phases of a Countermovement Jump
Force plates are no longer limited to professional and Olympic-level training environments. As access expands, more practitioners are regularly collecting countermovement jump (CMJ) data.
But while collecting jumps has become easier, interpreting them has not.
Force plates can provide insight far beyond jump height but only if you understand how to break the movement down.
That starts with the phases of the countermovement jump.
A Brief Comment on Force Plate Jumps
Before diving into the phases, it is important to clarify what force plates are actually measuring because this is often overlooked.
At the most basic level, force plates measure the force applied to the ground. In a standing position, this reflects the weight of the system (i.e., the athlete’s mass), measured in Newtons (N).
These measurements are collected at very high sampling rates, usually 1000 Hz, allowing us to track how force changes throughout the entire movement.
From there, we can apply Newton’s Laws to interpret the force-time curve.
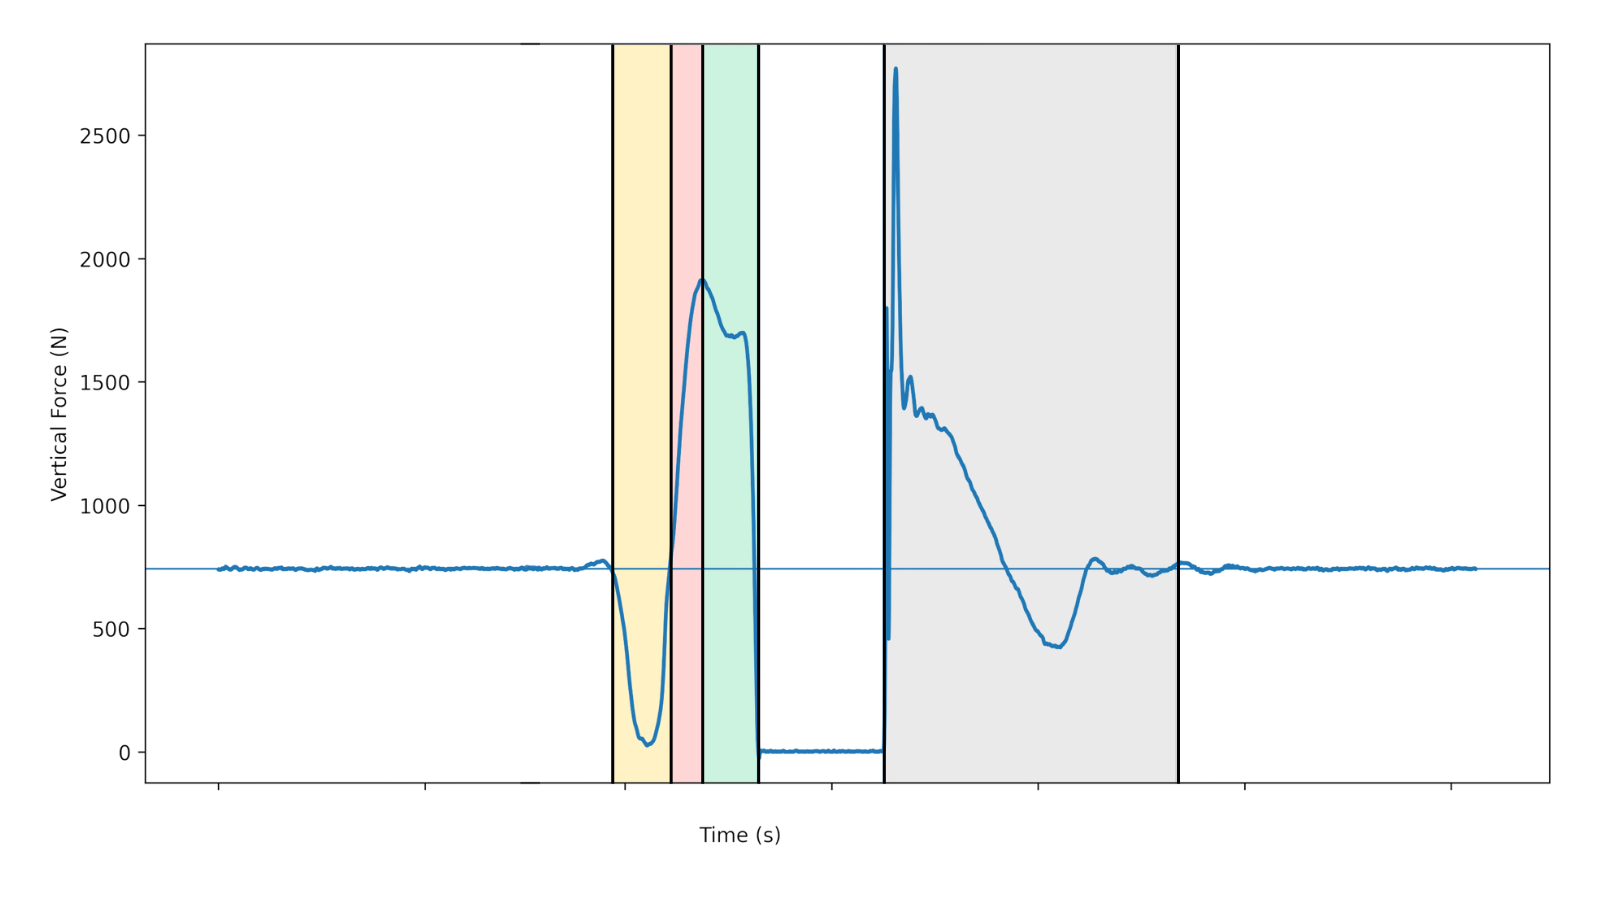
A CMJ force-time curve is simply a representation of how force is applied over time. Within that curve, the movement can be divided into distinct phases based on how force and velocity change.
The Six Phases of a Countermovement Jump
The countermovement jump can be broken down into six key phases:
- Baseline
- Unweighting
- Braking (Eccentric Deceleration)
- Propulsive (Concentric)
- Flight
- Landing
Each phase provides a different lens into how the jump is performed.
Individually, they highlight specific aspects of movement strategy.
Together, they form a complete picture of performance.
Understanding these phases and the variables within them is what allows force plate data to move from numbers on a report to meaningful programming decisions.
Article Contents:
Phase 1: Baseline
Though often overlooked, the “quiet” period where a subject’s baseline bodyweight is established is a critical component of accurate countermovement jump analysis.
This period is typically at least one second of stationary standing an it is used to determine bodyweight (in Newtons).
The quiet period also defines the start of the jump. Most analysis software identifies movement onset using a threshold based on variability during this phase, commonly ±5 standard deviations from the mean bodyweight.
Bodyweight also becomes the reference point for calculating net impulse and, ultimately, jump height, as well as many other derived metrics.
If the baseline period is inconsistent or poorly captured, it creates downstream error throughout the entire force-time analysis.
Key Setup Considerations
• Stand tall (hips and knees fully extended)
• Maintain natural weight distribution between limbs
• Standardize arm position (e.g., hands on hips if required by the protocol)
Phase 2: Unweighting
The unweighting phase begins at the initiation of downward movement, effectively the start of the jump, and continues until maximum downward velocity is reached.
Movement onset is typically defined using a threshold relative to the baseline phase. Most commonly, this is identified when ground reaction force deviates beyond ±5 standard deviations of the baseline bodyweight.
On the force-time curve, the unweighting phase is characterized by force dropping below bodyweight. This reflects the athlete accelerating downward, a brief period of controlled “free fall”, resulting in reduced ground reaction force.
The slope of the force-time curve during this phase can provide insight into movement strategy and intent. A rapid drop in force suggests a more aggressive initiation, where the athlete is confident in their ability to reverse the movement. A more gradual reduction may reflect a more cautious strategy.
The magnitude of unweighting also varies between athletes. Some will show relatively small reductions in force (e.g., ~60% of bodyweight), while others demonstrate much larger reductions (e.g., 75–90%), often associated with more dynamic jump strategies.
Interpreting this phase should always be done in context as strategy can be impacted by the athlete’s sport, injury history and task cues (i.e., jump high vs. jump fast).
Key Considerations
• Defined by deviation from baseline force
• Force drops below bodyweight due to downward acceleration
• Slope reflects intent and movement strategy
• Magnitude of unweighting varies between athletes
Phase 3: Braking (Eccentric Deceleration)
The braking phase, often referred to as eccentric deceleration, is the period where the athlete reverses their downward momentum. In simple terms, this is where they are “slamming on the brakes.”
Mechanically, this phase is characterized by positive acceleration while the athlete is still moving downward, meaning they are producing force in the opposite direction of travel to decelerate the center of mass.
On the force-time curve, the braking phase begins when force rises back above bodyweight and continues until the first force peak, which typically coincides with the lowest center of mass position.
This phase places a high demand on the system’s ability to absorb and redirect force. While often associated with eccentric strength of the quadriceps, it reflects a broader capacity involving coordination, stiffness, and whole-system force control.
Higher peak forces during this phase are often associated with a more rapid deceleration strategy, though this should always be interpreted in context of movement strategy and overall jump performance.
Key Metrics
• Braking rate of force development (RFD)
• Net eccentric (braking) impulse
• Left-to-right braking impulse asymmetry
Phase 4: Propulsive (Concentric)
The propulsive phase, or the concentric phase, begins at the lowest center of mass position, as the athlete transitions from downward to upward movement, and continues until take-off.
During this phase, the athlete accelerates upward, generating force to overcome bodyweight and impart upward velocity to the system. As a result, the effectiveness of the propulsive phase is heavily influenced by how the braking phase is performed.
From a mechanics standpoint, the net impulse generated in this phase determines take-off velocity, which in turn determines jump height.
While it may be assumed that maximum velocity occurs at take-off, peak velocity is typically reached slightly before take-off as force production decreases toward zero.
On the force-time curve, many athletes display a second force peak in the latter portion of this phase before force drops off approaching take-off. This is often referred to as a bimodal force-time profile, though some athletes exhibit a more unimodal pattern depending on their strategy.
Movement-wise, triple extension of the hips, knees, and ankles is commonly observed, often in a proximal-to-distal sequence. However, the exact coordination pattern can vary between athletes and should be interpreted in the context of overall performance and sporting demands.
Athletes may achieve similar jump heights through different combinations of force and velocity within this phase.
Key Metrics
• Net propulsive impulse
• Relative propulsive power
• Left-to-right concentric impulse asymmetry
• Take-off velocity
Phase 5: Flight
The flight phase spans from take-off (toe-off) to touchdown.
While often overlooked in force plate analysis, this phase still provides useful context. From a qualitative standpoint, it allows practitioners to observe movement characteristics such as balance, symmetry, and body control in the air. Athletes may also alter their landing strategy, for example, pulling the feet up before contact, which can artificially increase measured flight time.
A key advantage of force plate systems is that jump height is calculated from take-off velocity (derived from impulse), rather than relying on flight time. As a result, flight-time–based estimates of jump height can be inflated if an athlete manipulates their landing position.
Some systems also report a “landing height” metric. This reflects the effective drop distance from just before ground contact and is often slightly greater than the measured jump height. This difference is influenced by factors such as foot orientation at take-off and touchdown.
From a practical standpoint, a higher landing height implies a greater downward velocity at contact, increasing the braking demands required during the landing phase.
Key Considerations
• Flight time can be influenced by landing strategy
• Jump height on force plates is derived from take-off velocity, not flight time
• Qualitative observation of movement control can provide additional context
• Landing height influences subsequent braking demands
Phase 6: Landing
The landing phase begins at ground contact and continues until the athlete returns to a stable, stationary position.
This phase has always been one of the most interesting — and most important — aspects of jump analysis. In many sports, particularly those involving high forces and complex aerial movement, landings are where injuries are most likely to occur. This is especially true in the halfpipe skiers and snowboarders that I work with, where athletes are repeatedly exposed to high-impact landings.
My interest in this phase led me to complete my Master’s degree investigating the role of strength and ACL injury history on landing strategy. You can read my Master’s thesis here.
From a force plate perspective, the landing phase provides insight into how an athlete absorbs and redistributes force. It reflects a combination of eccentric strength, coordination, and strategy similar to the braking phase, but under different conditions and often higher velocities.
Key characteristics to observe include how quickly force is developed upon contact, how evenly it is distributed between limbs, and how effectively the athlete can stabilize following impact.
Key Metrics
• Peak landing force
• Landing rate of force development (RFD)
• Left-to-right force asymmetry
• Time to stabilization
Bringing It All Together
Understanding the phases of a countermovement jump is what allows force plate data to move beyond numbers and into meaningful decisions.
Each phase provides a different perspective on how the jump is performed, from how the movement is initiated, to how force is absorbed, to how it is ultimately expressed.
But no single phase tells the full story.
The value comes from understanding how the phases interact.
An athlete who produces high propulsive forces may rely on an aggressive braking strategy. Another may achieve similar jump heights through a more controlled approach. Without understanding the full force-time profile, these differences are easily missed.
This is where force plate analysis becomes powerful, in understanding movement strategy and how it changes based on training, fatigue, injury and coordination.
And ultimately, using this understanding to guide training, monitor adaptation, and inform return-to-sport decisions.